
Introduction
Year-over-year (YOY) analysis is a type of recurring and comparative analysis. It is used for financial statement items and key metrics in business, economics, and health to see and compare results year after year. This allows management to understand not only how their business is doing compared to past years but also how they do at different times of the year compared to other periods. This type of period-to-date comparison is called a ‘running or rolling YOY’ and is also called a ‘trailing twelve months’ (TTM) comparison when comparing the twelve months of the last complete year. It leaves us comparing the twelve months to the most recent twelve-month period available.
Definition of Year-Over-Year Analysis

Year-over-year analysis is the assessment of changes in the same item or aspect over twelve months. By comparing the present and past figures for a specific variable, one can compute the percentage of increase or decrease in the past year’s data concerning the current year. Such an analysis is fundamental, particularly in a dynamic environment that harbors constant changes, in predicting trends and in making critical decisions, be it in the business world or the government sectors. The analysis will provide insight into how a particular variable has performed in the past and help one to have a sense of how it is likely to perform in the future. One will be able to identify trends or phenomena that recur after several years, and it could help in unravelling mysteries or clearing erroneous conventional wisdom. However, this analysis is not always very useful, especially when there are extreme values, and care must be taken in interpreting the results. It is also important to ensure that whether the year-over-year analysis is meaningful or not, proper and safe comparisons can be made.
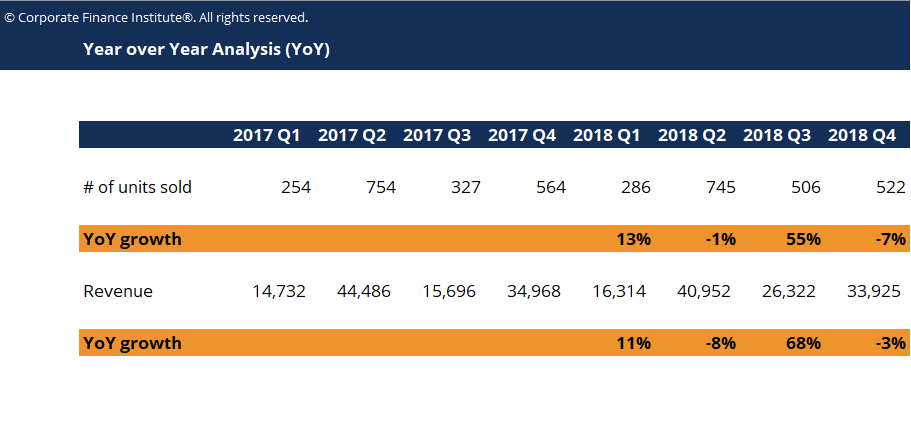
Example
For example, if sales for a company were 100,000 in 2019 and 120,000 in 2020, then the YOY growth for 2020 can be calculated as follows: (120,000-100,000) / 100,000 * 100 = 20% YOY growth. However, YOY figures should be taken in context and one should be aware of their limitations. A great example is in purchasing – if a company has a bad month in January and a great month in March, then both April and May will look artificially strong in a YOY analysis, ignoring the poor January that caused it. Product launches can make YOY figures too conservative. Additionally, YOY growth will not necessarily tell you why revenues have grown or decreased – only that they have. Such an understanding requires a more detailed analysis. This is where things like trend analysis become important, which I will discuss in another post.
Uses of Y-O-Y

It is very helpful for seasonal businesses and can also allow them to spot longer trends and changes in a business. For example, when increased marketing expenditure results in an increase in the number of customers and also the number of sales, profit in the following year will go up. These effects can be quantified using year-over-year analysis by comparing the profit figures. Year-over-year is also used for fund performance as well. Fund managers are often compared to a benchmark or an index using year-over-year returns to show how the fund has performed, and it is very valuable to understand and contextualize recent fund returns in light of long-term performance signalled by year-over-year patterns. The following rule should be followed to work out a year-over-year change: subtracting the older period from the newer period and then dividing the result by the older period. Then, multiply the result by 100 to calculate the percentage change. However, we may not always have complete years of data to compare. For example, if someone wants to compare temperatures in the first half of the current year to temperatures in the entire previous year.
Purpose of the Work
The purpose of this work is to explore the “year over year analysis” which refers to the comparison of data for a particular year with the data from the previous year to understand the performance of a given measure. Year-over-year analysis methodology, its applications in different domains, and the future trends of this type of analysis. The benefits of using year-over-year analysis, the calculation of year-over-year changes, and the interpretation of the results will be explained in this work. Also, it will show how year-over-year analysis can be used in different scenarios to analyze the performance of key measures over time. I think this work is important for professionals, particularly those working in the areas of business and data analysis because it will provide an overview of how year-over-year analysis can be used and the type of results that can be produced from a data set based on this type of analysis.
Factors Affecting Year Over Year
Profits
Profits, of course, are the key refuge of most businesses, and it’s important to understand that changes in the economic environment can have a big effect on them. For example, there may be a change in aggregate demand, meaning that the level of demand at the current price level is reduced. This can come about because of several factors – changes in interest rates, changes in the exchange rate or, as we’ve seen happen to some countries in Europe, there can be major structural change caused by a fiscal consolidation program. Whatever the reason, a change in aggregate demand is most likely to affect the company’s’s profits. A firm may have to sell off more stock to maintain a given level of turnover (output x price) if demand has fallen – but equally, if demand has risen, then the firm may have to invest in more stock to meet the increased demand.
GDP
Another important economic factor that wishbring to your attention is the GDP – the Gross Domestic Product. This is a measure of the total goods and services produced in a large economy. It’s effectively used to put a value on a country’s productivity, which can also be highly affected by the production possibility frontier – a key economic theory. We know from studies of macroeconomics that a big rise in GDP could put prices up in the economy, which would also drive up the interest rate and reduce long-term economic growth. It’s important that the growth in GDP is neither too low nor too high – and that businesses plan for any substantial changes in this most valued of economic indicators!
Economic Factor
A variety of economic factors can have a direct impact on the business environment. The most common include changes in the the market, changes in price, and changes in the quantity of goods and services that an economy can produce. But there are also other factors, such as the overall economic environment and the sophistication of the economic structures. These factors can have a big impact on the way that companies do business.